US elections vote shift
October, 2018
Tech stack: D3.js, SVG, d3-annotation and Omniscope
The project was inspired by a visualisation on Nació Digital about the Catalan elections of 2017.
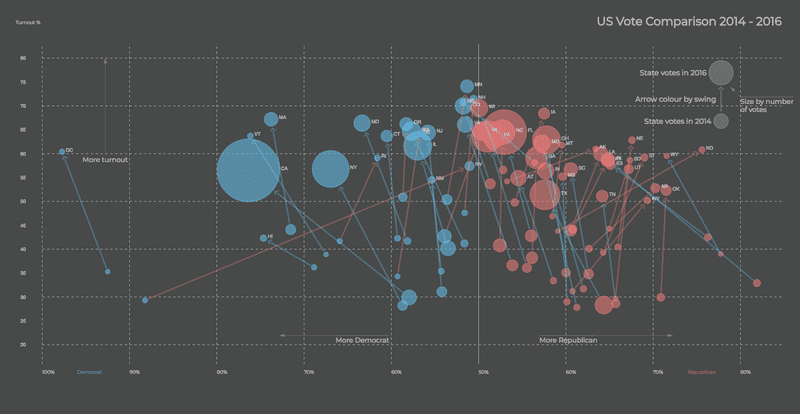
US vote comparison between 2014 and 2016 elections. The visualisation shows the vote shift per state and turnout percentage.
Each circle represents a state and year sized by the number of votes. Vertically positioned by the turnout percentage and horizontally by the Democrat/Republican support.
Because the visualisation could end up with too much clutter, it also includes some annotations using the library d3-annotation to help the viewer identify the visual encodings and their meanings.