Live cryptocurrency transactions flow
March, 2019
Tech stack: D3.js, d3-annotation, SVG, TokenAnalyst API, Java and Omniscope
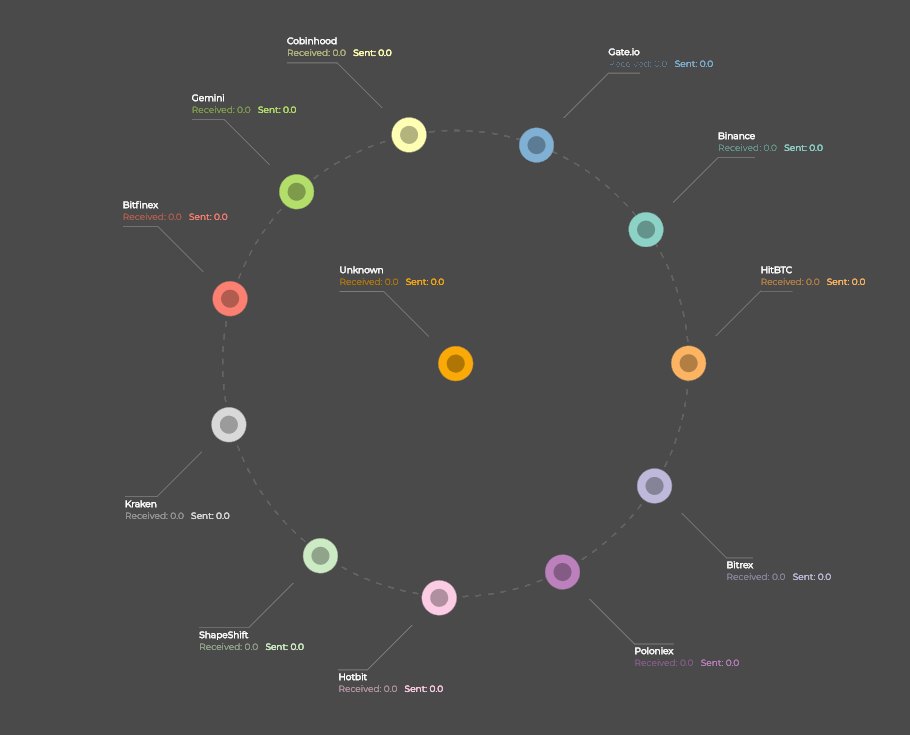
This visualisation shows live Ethereum transactions between companies based on data from TokenAnalyst.
Every circle represents a company with an inner and outer circle for received and sent accumulated transaction amounts. With the circle in the centre representing all unknown sources. The visualisation continuously updates and adds new companies as they are read from new transactions. The transactions are then represented by circles moving from one company to another sized by the amount. Finally, the values and sizes of the companies are updated.