Bank transactions exploratory graph
April, 2019
Tech stack: D3.js, graphlib, Paper.js, Javascript and MicroStrategy
Graph visualisation tool to analyse in an exploratory way transactions between banks and investigate the impact of multiple level transactions routes from an origin branch point. The bundled tool can be integrated in a
The project involved the integration of the data, transformation into a graph structure and visualisation in
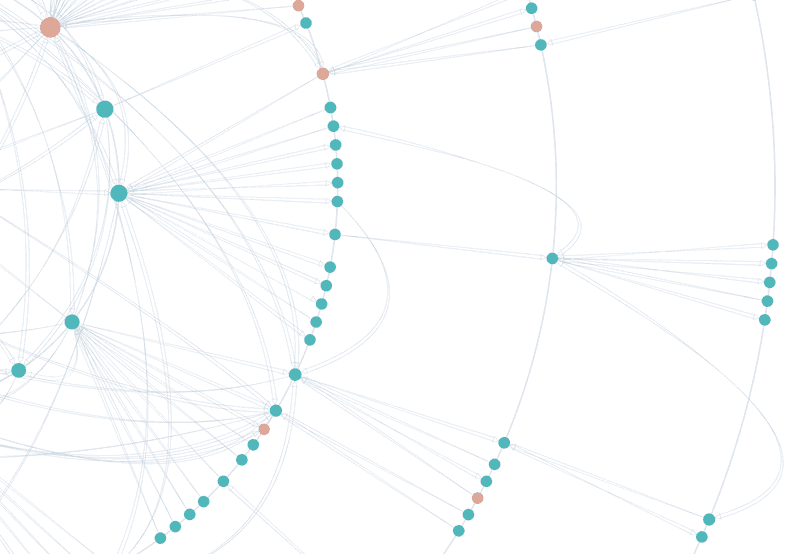
For the visualisation, I created a custom layout algorithm that works as an extra layer in-between the usual D3.js data flow. This layout can be swapped by any other built-in D3.js layout, such as force-layout in this case, which the user can choose from a panel. The custom layout takes a tree data structure and positions the nodes in different levels, laying them out in the circumferences taking into account node size and the sector size of the subsequent nodes.
Along with the radial layout, the curved arrows are also customised as SVG shapes to represent bidirectionality and the amount of the transactions. The blueprint of the arrows can be seen in the screenshot below.
For more information or a live demo of this project, please contact me at hello(@)guillemsegura.com.